Stop estimating. Start calculating. Whether you’re scaling a last-mile delivery operation or equipping a municipal service team — the purchase price is only a fraction of what you’ll actually spend.
The calculator is designed to be usable in under two minutes, with no spreadsheet required. Here's how to get the most accurate result:
Click one of the four tabs at the top: Last-Mile Delivery, City Logistics, Municipality, or Micro Fleet. Each tab loads defaults based on typical European fleet profiles. You can change any value after selecting — the scenario is a starting point, not a constraint.
Enter the number of bikes and unit price. If financing through a loan or operational lease, switch the financing method and enter the rate or monthly payment. Set the ownership period — 5 years is standard for most commercial fleets, municipalities often plan for 7.
Daily kilometres per bike and operating days per year drive your energy cost. Energy consumption defaults to 20 Wh/km for a mid-range cargo bike; heavy-load trikes will be closer to 28–35 Wh/km. Use your local commercial electricity rate — the EU average in 2025 is approximately €0.26–0.31/kWh for business customers.
Annual maintenance averages €300–€600 per bike for front-loader two-wheelers, rising to €500–€900 for cargo trikes. Insurance is typically €180–€350 per bike per year in Western Europe. Set your battery replacement interval based on expected daily cycle count.
The right panel shows total fleet TCO, annualised cost per bike, monthly cost, and cost per kilometre. Use the period pills (1yr / 3yr / 5yr / Full) to model different time horizons.
Tip: For procurement presentations or grant applications, switch to “Full” period to show the complete lifecycle cost, then switch to “1 yr” to show the annual budget line.
Total Cost of Ownership (TCO) is the sum of every euro spent acquiring and operating an asset over its useful life. For a cargo bike fleet, that means going beyond the sticker price to capture five distinct cost categories.
Unit price × fleet size, adjusted for residual value at end-of-life. If leasing, this becomes total lease payments; if borrowing, add interest over the loan term. For a detailed breakdown of what drives unit prices, see our complete cargo bike cost breakdown.
E-cargo bikes are exceptionally efficient: 20 Wh/km on an 80 km daily route costs approximately €0.45 per bike per day at €0.28/kWh — roughly €112 per bike annually. A rounding error compared to diesel van fuel.
Includes scheduled servicing, tyre replacement, brake pads, drivetrain wear, and minor component replacement. Modular designs allow most repairs to be completed by a trained technician in under 48 hours.
Commercial fleet insurance typically covers theft, damage, and third-party liability. Premiums vary by country: Dutch and German insurers offer the most competitive rates for commercial fleets of 5+ bikes.
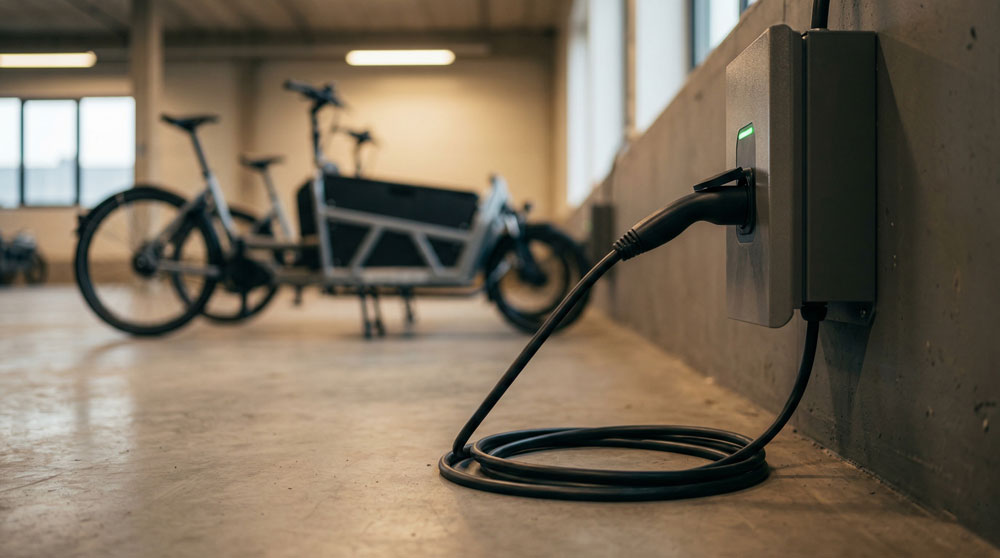
The most underestimated cost in most fleet projections. A quality battery rated for 800+ cycles needs replacement between year 3 and year 5. Budget €650–€1,200 per unit per replacement cycle.
Tip: For a deep-dive into how each cost compounds over a fleet’s lifetime, see our full cargo bike cost breakdown guide.
These benchmarks are derived from publicly available operator data, EU-funded research (EIT InnoEnergy, 2023), and fleet case studies across the Netherlands, Germany, France, and Belgium.
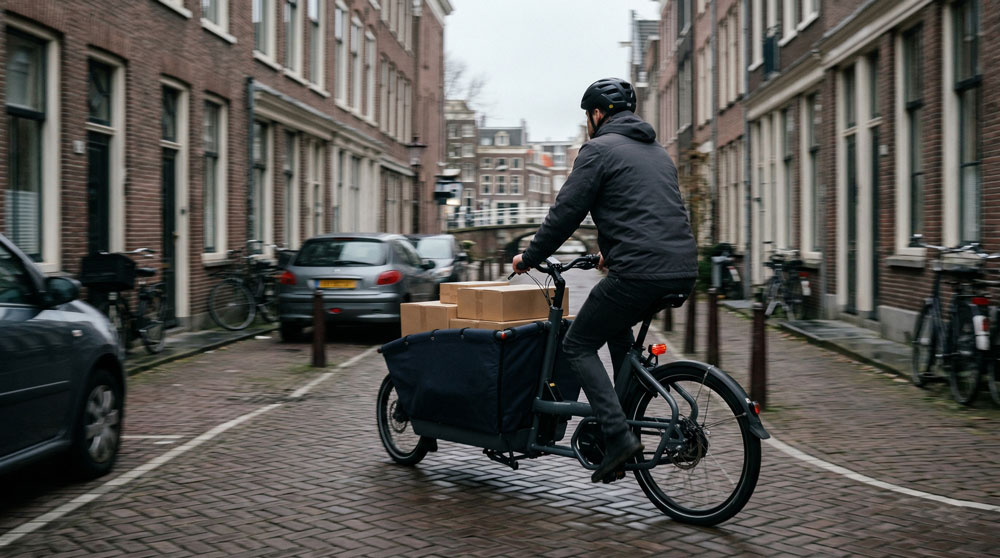
Typical profile: parcel courier or e-commerce operator, urban density, 70–90 km/day per bike.
| Cost Category | Annual (Fleet) | 5-Year Total |
|---|---|---|
| Acquisition (amortised) | €8,100 | €40,500 |
| Energy | €1,100 | €5,500 |
| Maintenance | €4,200 | €21,000 |
| Insurance | €2,600 | €13,000 |
| Battery replacement | — | €8,500 |
| Total (excl. labour) | ~€16,000 | ~€88,500 |
Cost per km (excl. labour): €0.08–€0.12
Typical profile: urban freight, micro-hubs, larger cargo formats (trikes or enclosed quads), heavier maintenance cost.
| Cost Category | Annual (Fleet) | 5-Year Total |
|---|---|---|
| Acquisition (loan, amortised) | €10,200 | €51,000 |
| Energy | €1,100 | €5,500 |
| Maintenance | €3,360 | €16,800 |
| Insurance | €1,860 | €9,300 |
| Battery replacement | — | €6,600 |
| Financing interest | ~€2,300 | ~€11,500 |
| Total (excl. labour) | ~€18,800 | ~€100,700 |
Cost per km (excl. labour): €0.16–€0.22
Typical profile: parks maintenance, waste collection support, public health services. Lower daily mileage, longer ownership period, rider labour included.
A 7-year municipal fleet of 8 bikes with full-time riders costs approximately €680,000–€820,000 in total TCO including labour — but the labour cost accounts for over 80% of that figure.
The vehicle operational cost (excl. labour) is typically under €130,000 over 7 years, making e-cargo bikes a cost-efficient choice relative to any motorised alternative for sub-15 km daily routes.
Typical profile: small local business, NGO, dark store operator, or B2C brand pilot. Lower daily mileage (20–35 km), tight budget, often cash purchase.
5-year TCO for a 2-bike micro fleet typically lands between €12,000 and €20,000 — less than the annual fuel and parking cost of a single delivery van in a major European city.
Tip: For guidance on how your cargo bike fleet can structure procurement and TCO, see the complete B2B cargo bike procurement guide for 2026.
The most common question B2B buyers ask is not "how much does a cargo bike cost?" but rather: "Is it cheaper than the van I'm replacing?"
The answer depends on route density and daily kilometres, but the data is increasingly clear for urban operations under 15 km per route.

A 2023 study by EIT InnoEnergy — commissioned by the European Union — found that in a mixed fleet operating in a medium-sized European city, e-cargo bikes reduced the cost per parcel compared to a pure e-van fleet: approximately €1.36 per parcel for a bike-inclusive fleet vs €1.41 for e-vans only. By 2030, that gap is projected to widen to €0.20 per parcel as battery costs continue to fall.
In an optimised scenario with 80% e-cargo bikes and 20% e-vans, annual savings for a large logistics operator reach an estimated €156 million today, rising to €554 million by 2030.
A Brussels field study by courier operator Urbike found that cargo bikes completed a typical 8.5 km urban route in 48 minutes versus 99 minutes for vans navigating the same addresses — more than twice as fast. Bikes delivered 10.1 parcels per hour compared to 4.9 for vans serving identical destinations.
For operations in dense city centres, the productivity advantage alone can justify the fleet switch before a single cost calculation.
Standard TCO models capture fuel and maintenance. They routinely omit:
Add these factors into your model and the e-cargo bike advantage compounds further. For a scenario-based breakdown, see our cargo bike use cases guide.

01
A fleet of 10 bikes will have a meaningfully lower TCO per bike than a fleet of 2, primarily through negotiated unit pricing (typically 8–15% discount at 10+ units), shared maintenance contracts, and lower per-bike insurance premiums. The EIT InnoEnergy analysis confirmed this pattern: larger fleets consistently achieve lower per-unit operational costs.
02
Energy cost is the most elastic variable. A bike running 40 km/day at 18 Wh/km costs roughly half as much to charge annually as one running 100 km/day at 28 Wh/km. Operators using GPS telematics report accuracy gains of 20–30% over manual estimates.
03
The longer you own, the lower the annualised acquisition cost — but the higher the maintenance cost in later years. Five years is the sweet spot for most commercial fleets. Municipalities and NGOs often extend to 7 years using robust mid-drive motor platforms.
04
Cash purchase minimises total cost but ties up capital. Operational leasing (€120–€300/bike/month) converts capex to opex. See the B2B procurement guide for tender processes and leasing contract structures.
05
Quality cargo bike frames hold their value well — a well-maintained bike from a tier-1 manufacturer typically retains 15–25% of its purchase price after 5 years. Budget bikes may have near-zero residual value, making total lifetime cost higher despite a lower sticker price. Model your residual value conservatively (10–15%) unless you have an established remarketing channel.

There is no universally correct answer, but there are clear patterns by operator type:
Best For
Courier SMEs, logistics startups, NGOs, operators wanting guaranteed maintenance included. The predictable monthly outgoing simplifies cash flow, and many European leasing providers now offer cargo-bike-specific contracts with integrated service.
Best For
Larger operators with access to capital, organisations benefiting from EU or national subsidy programmes (which typically require ownership, not leasing), and businesses with an existing internal maintenance function.
Best For
Operators who want ownership benefits (residual value, asset on balance sheet) but need to spread the capital investment. Check whether your national development bank (KfW, BpiFrance, etc.) offers green-mobility loan products — these often carry rates 1–2 percentage points below standard commercial lending.
For a detailed comparison of procurement contract structures and supplier financing options, see the complete B2B cargo bike procurement guide.
For a detailed comparison of procurement contract structures and supplier financing options, see the complete B2B cargo bike procurement guide.
All calculations are estimates for planning and comparison purposes. Actual costs vary by region, supplier, usage conditions, and market pricing. This tool does not constitute financial advice. Cost benchmarks updated Q1 2026.

CargoBikeHub Research
Independent research on the cargo bike supply chain — manufacturers, certification, and fleet economics.
Every claim on this page traces to a primary source. Found an error? Tell us — we correct within 48 hours.
About our method →
Cargo Bike Hub
Cargo Bike Hub is an open and transparent knowledge platform dedicated to the upstream cargo bike industry—sharing supply chain intelligence, user insights, and market trends to empower better decisions, foster collaboration, and drive sustainable growth across the global cargo bike ecosystem.
©2026. CargoBikeHub. All Rights Reserved.
